Primer Tm Calculator for quick PCR planning
A Primer Tm Calculator estimates the melting temperature of a DNA primer. Tm is the temperature where about half of the primer-template duplex is expected to be annealed and half is expected to be separated under the stated assumptions. PCR uses this value to choose a sensible annealing temperature before optimization.
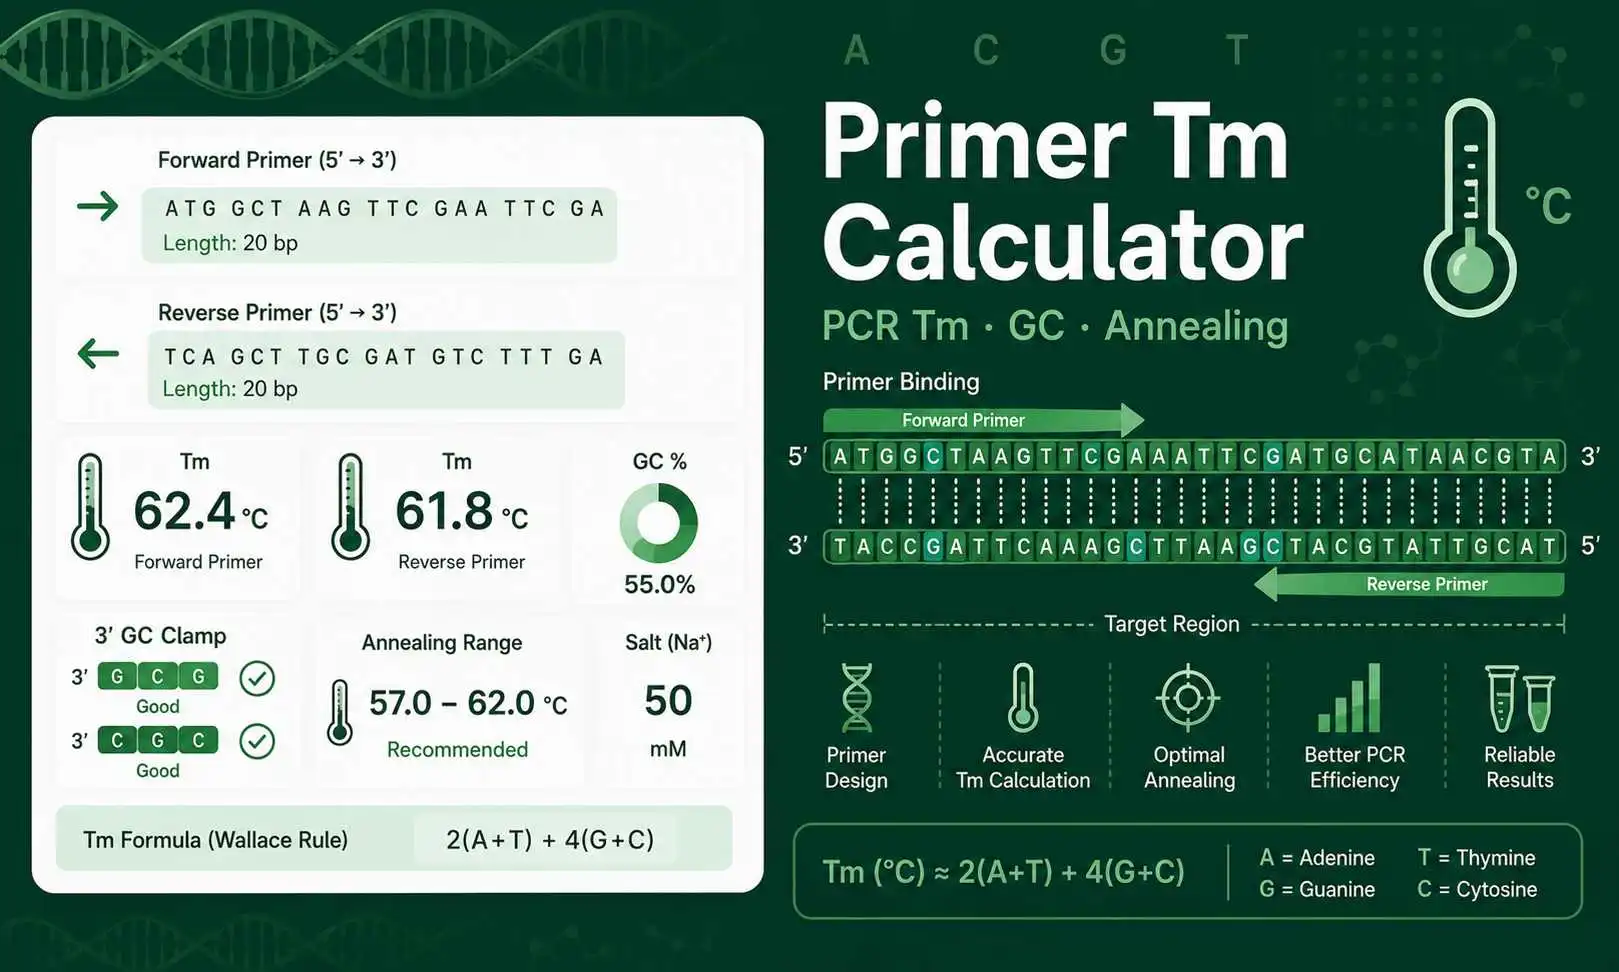
This calculator accepts a forward primer, an optional reverse primer, and a monovalent salt value. It reports primer length, GC content, base composition, 3′ GC clamp, estimated Tm, pair Tm difference, and a starting annealing temperature range. It also gives warnings for common beginner issues such as very low GC content, very high GC content, long homopolymer runs, and large primer pair Tm differences.
How to use Primer Tm Calculator results
Paste the primer sequence in 5′ to 3′ direction. Use only A, C, G, and T. You can paste one primer for a single-primer Tm check or paste both forward and reverse primers for a PCR pair comparison. The calculator removes spaces, line breaks, numbers, and FASTA headers before analysis.
Start by checking whether both primers have similar Tm values. A small difference is easier to use in PCR than a large difference. Many routine primer pairs work better when their Tm values are within about 3–5°C of each other. If the difference is larger, redesign may be easier than repeated PCR optimization.
Primer Tm formula used by this calculator
For primers shorter than 14 bases, the calculator uses the Wallace rule. The equation is: Tm = 2(A + T) + 4(G + C). This simple formula is useful for short educational examples because it shows why G and C bases increase Tm more than A and T bases.
For longer primers, the calculator uses a basic salt-adjusted estimate: Tm = 81.5 + 16.6 log10([Na⁺]) + 0.41(GC%) − 675/N. In this equation, [Na⁺] is the monovalent salt concentration in molar units, GC% is the percentage of G and C bases, and N is primer length. This is still an estimate. It does not replace nearest-neighbor calculations or polymerase-specific recommendations.
NEB provides a Tm Calculator that estimates appropriate annealing temperature for NEB PCR products and allows primer sequence entry with product-specific settings.NEB Tm Calculator
Worked example for primer Tm calculation
Suppose your primer is ATGCGTACGTTAGCGTACGA. It has 20 nucleotides. It contains 5 A bases, 4 T bases, 6 G bases, and 5 C bases. The GC count is 11, so GC content is 11 ÷ 20 × 100 = 55%.
Because the primer is longer than 13 bases, the calculator uses the salt-adjusted estimate. At 50 mM Na⁺, the estimated Tm is about 58°C. A practical first annealing range is usually a few degrees below the lower primer Tm in the pair, so a starting range near 53–55°C may be reasonable before gradient PCR optimization.
Use case 1: choosing a PCR annealing temperature
A student designing a PCR experiment can paste both primer sequences into the tool. If the forward primer has a Tm of 60°C and the reverse primer has a Tm of 59°C, the pair is close enough for a simple first test. The lower Tm is 59°C, so a first annealing temperature near 54–56°C is a practical starting point.
This is only a starting point. The final annealing temperature may change after checking template specificity, polymerase instructions, magnesium concentration, and gradient PCR results. Use theannealing temperature calculator when you want a page focused on PCR annealing setup.
Use case 2: checking primer redesign problems
A lab worker may receive a primer pair where one primer has 72% GC content and the other has 38% GC content. The Tm values may be far apart. The GC-rich primer may bind too strongly or form secondary structures, while the AT-rich primer may bind weakly. In this case, redesigning one or both primers can save time.
The 3′ end also deserves attention. A primer with no G or C near the 3′ end may bind weakly at the extension end. A primer with too many G and C bases at the 3′ end may increase nonspecific priming or primer-dimer risk. For a focused end-check, use the primer GC clamp checker.
Good primer Tm range and interpretation
Many standard PCR primers have Tm values around 55–65°C, lengths near 18–25 bases, and GC content near 40–60%. These ranges are practical starting points, not universal rules. Some assays need longer primers, higher Tm values, modified bases, or special cycling conditions.
Interpret the result with the full primer design context. Check target specificity, expected amplicon size, primer pair orientation, secondary structure, polymerase buffer, template complexity, and cycling protocol. A good Tm value does not guarantee a good PCR result.
Common Primer Tm Calculator mistakes
Do not paste RNA bases into a DNA primer Tm calculator. Replace U with T if you are checking a DNA primer. Do not paste ambiguity codes unless the tool supports them. Do not compare results from different calculators without checking their assumptions because salt correction, primer concentration, and nearest-neighbor settings can change the output.
Also avoid choosing the annealing temperature from one primer only when you are running PCR with a primer pair. The lower primer Tm often limits the starting annealing temperature. If the primer pair differs widely, a gradient PCR can show whether the pair still works.
What to verify before using primers in the lab
Verify the final primer sequence, strand direction, genomic or plasmid target, amplicon size, primer specificity, secondary structure, primer-dimer risk, and supplier concentration. For qPCR, also check amplification efficiency, melt curve specificity, no-template controls, and standard curve behavior.
Treat the calculator as a fast educational and planning tool. For critical experiments, confirm the design with a validated primer design workflow, supplier software, your polymerase protocol, and your lab supervisor.