Annealing Temperature Calculator for PCR setup
This Annealing Temperature Calculator estimates a practical starting annealing temperature for PCR. It uses the primer sequence to calculate primer Tm, GC content, 3′ GC clamp, and primer pair Tm difference. The result helps you decide where to begin when setting up PCR, colony PCR, cloning checks, or a simple teaching lab.
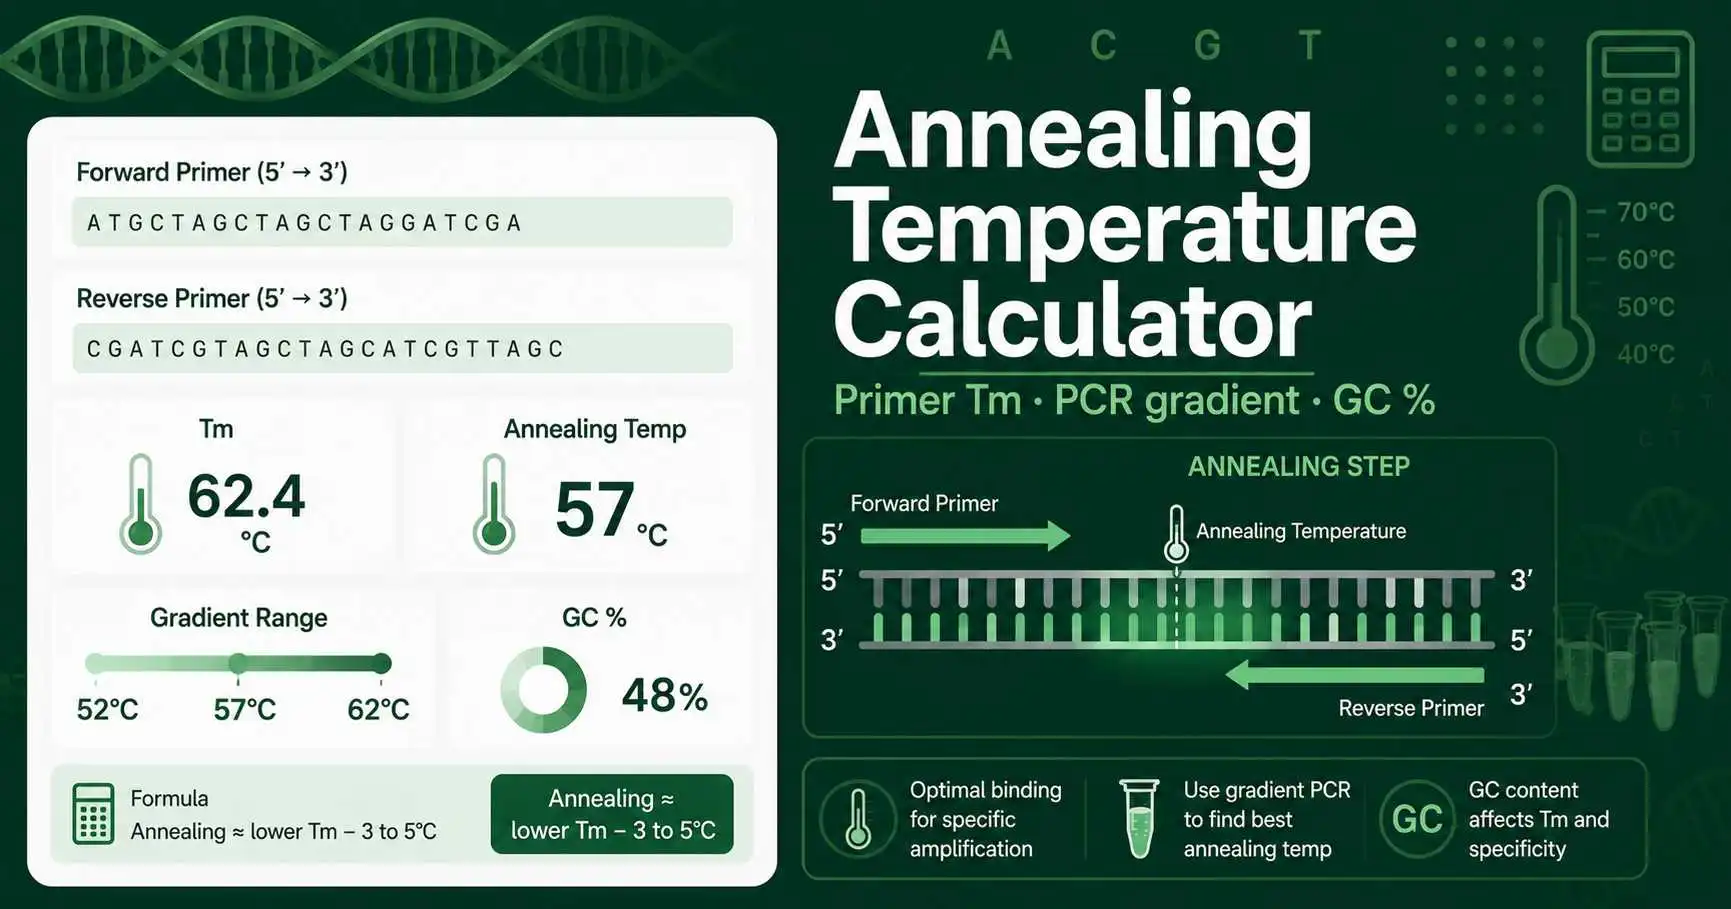
The tool works best for standard DNA primers written from 5′ to 3′. Paste the forward primer and reverse primer. The calculator uses the lower primer Tm as the main reference because both primers must bind during the annealing step.
How the PCR annealing temperature is estimated
A common PCR starting rule is simple: choose an annealing temperature about 3–5°C below the lower primer Tm. This does not guarantee the perfect condition, but it gives a useful first temperature for a PCR run or a gradient PCR plan.
For short primers below 14 bases, the tool uses the Wallace rule: Tm = 2(A + T) + 4(G + C). For longer primers, it uses a salt-adjusted educational estimate based on primer length, GC percentage, and monovalent salt concentration. If the primer pair Tm difference is large, the tool warns you because mismatched primers can reduce PCR efficiency or specificity.
For detailed thermodynamic modeling before final primer ordering, compare the result with the NEB Tm Calculator.
Worked example for annealing temperature
Suppose the forward primer has a Tm of 61.2°C and the reverse primer has a Tm of 59.8°C. The lower Tm is 59.8°C. If you use a 5°C offset, the estimated annealing temperature is 59.8 − 5 = 54.8°C. A practical gradient might test 55°C, 57°C, 59°C, and 61°C.
If the primer pair gives strong non-specific bands, increase the annealing temperature. If the PCR gives weak or no product, test a lower temperature, check Mg²⁺ conditions, review primer design, and confirm that the expected amplicon exists in the template.
Use cases for PCR annealing temperature calculation
In a student PCR practical, this calculator helps learners connect primer sequence, GC content, melting temperature, and annealing temperature. It also helps them explain why AT-rich primers often need a lower annealing temperature than GC-rich primers.
In routine lab work, the tool helps you choose a starting temperature before setting up PCR reactions. For example, you can calculate primer pair Tm, then prepare the reaction with aPCR Master Mix Calculator and confirm primer temperature details with a Primer Tm Calculator when needed.
Practical problem: choosing a gradient PCR range
Imagine a primer pair has a lower Tm of 62°C. A normal first estimate would be 57–59°C. To optimize the assay, set a gradient around that estimate, such as 55°C to 64°C. Lower temperatures may increase yield but can increase non-specific binding. Higher temperatures can improve specificity but may reduce product amount.
Use the lowest clear specific band as a clue, not as an absolute answer. PCR conditions also depend on template complexity, primer concentration, extension time, polymerase buffer, Mg²⁺, and cycling program.
Annealing temperature results explained
The recommended temperature is a starting value, not a final guarantee. The suggested range shows a common zone below the lower primer Tm. The primer Tm difference tells you whether the forward and reverse primers are well matched. A difference within about 5°C is often easier to optimize than a pair with a much wider gap.
GC content and the 3′ GC clamp help explain primer binding strength. Moderate GC content can support stable binding. A small G/C presence near the 3′ end can help extension, but too many G or C bases at the 3′ end may raise primer-dimer risk.
Limits and checks before using the result
This calculator uses educational estimates. It does not model every buffer component, Mg²⁺ concentration, primer concentration, mismatch, chemical modification, or template secondary structure. Always verify critical PCR conditions with the polymerase manual and your lab protocol.
Before real lab use, check primer specificity, expected PCR product size, template quality, primer-dimer risk, and negative controls. For qPCR, also verify primer efficiency, melt curve quality, and standard curve performance.