Z-Score Calculator formula and meaning
A z-score tells you how far a value sits from a reference mean in standard deviation units.
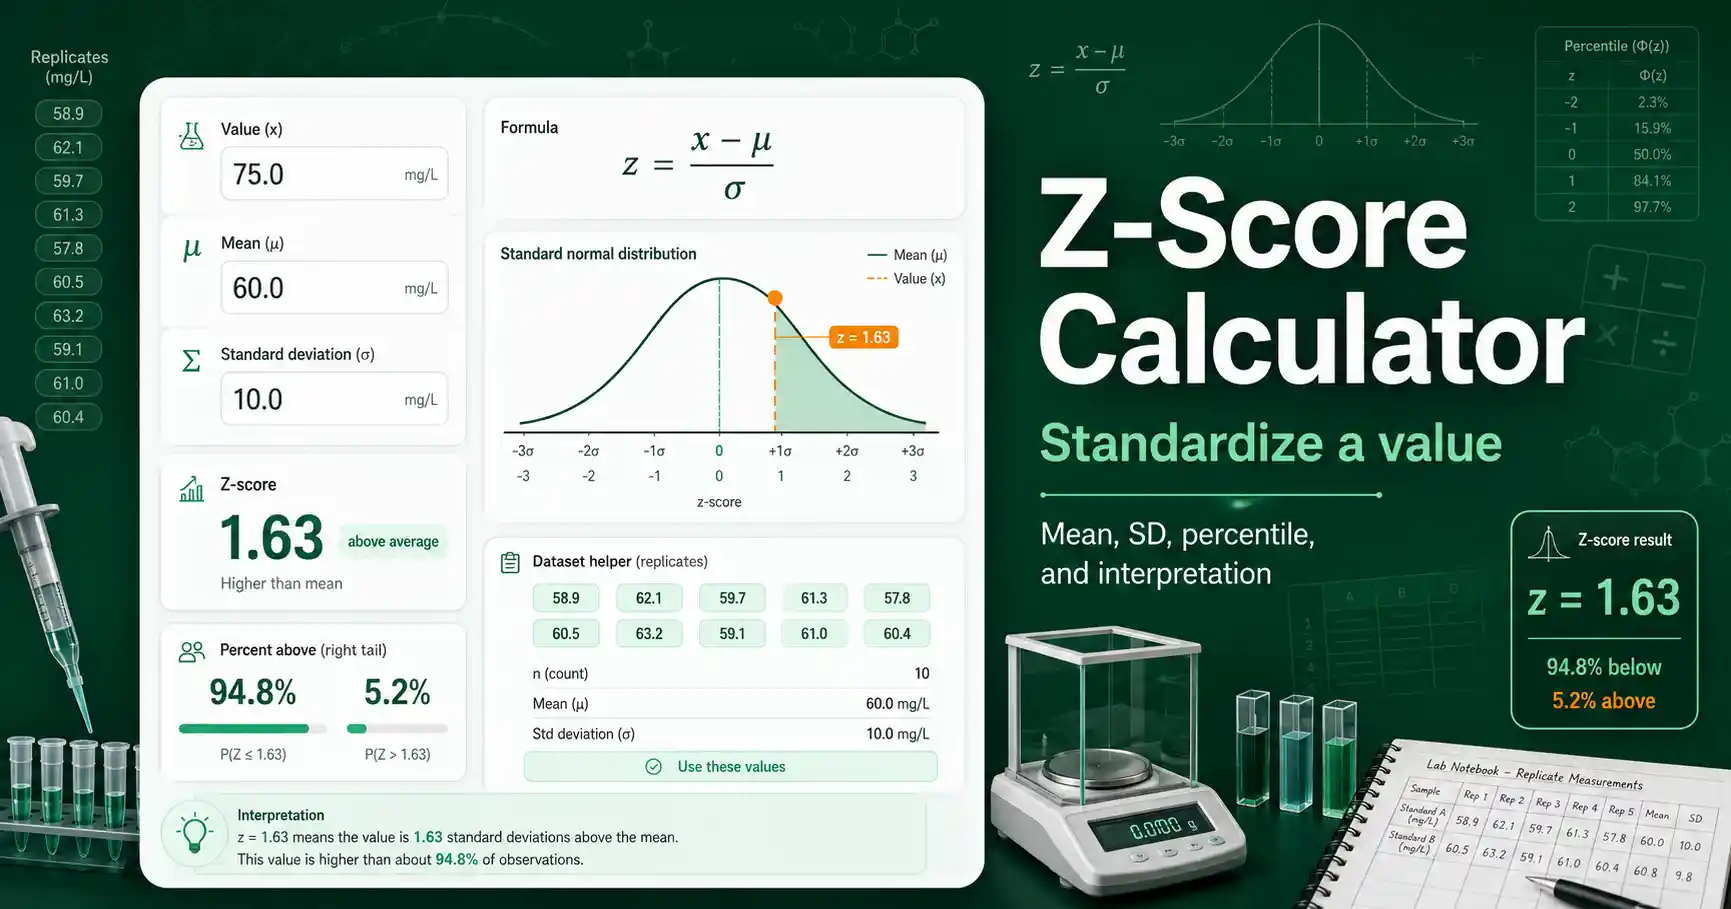
The calculator uses the formula z = (x − μ) / σ, where x is the measured value, μ is the mean, and σ is the standard deviation.
A z-score of 0 means the value equals the mean.
A z-score of 1 means the value is one standard deviation above the mean.
A z-score of −1 means the value is one standard deviation below the mean.
The input value, mean, and standard deviation must use the same unit for the result to make sense.
If an absorbance value is measured in AU, the mean and standard deviation must also describe absorbance values in AU.
If a concentration value is measured in µM, the mean and standard deviation must also describe concentration values in µM.
The standard deviation must be greater than zero because zero variation cannot define a standard distance from the mean.
The calculator also estimates the percent of a normal distribution below and above the z-score.
These percentile estimates are useful for interpretation, but they assume that the reference data behave approximately like a normal distribution.
For a clear explanation of z-scores in statistics, OpenStax describes standard scores as a way to compare observations from different normal distributions in its normal distribution chapter.
Z-Score Calculator inputs for lab data
Students can use this tool to check homework problems that ask for a standardized value.
Teachers can use it to demonstrate how a raw score changes into a standard score.
Lab workers can use it as a quick screening calculation for replicate measurements, quality-control checks, or assay readouts.
Researchers can use it to compare a sample result with a reference distribution when the mean and standard deviation are known.
The value input is the observation you want to standardize.
The mean input is the center of the reference set.
The standard deviation input is the spread of that reference set.
You can paste replicate values into the optional dataset helper to calculate a mean and standard deviation from your own data.
Use the Sample Mean Calculator when you need a more focused summary of mean, median, range, and standard error.
Use the Outlier Checker when the main question is whether a replicate value looks suspicious rather than simply standardized.
Z-Score Calculator result interpretation
Small absolute z-scores are close to the mean.
A value near z = 0 is very typical for the reference distribution.
A value between z = 1 and z = 2 is noticeably above the mean.
A value between z = −1 and z = −2 is noticeably below the mean.
Values beyond about two standard deviations may deserve attention in quality-control work.
Values beyond about three standard deviations are often considered extreme under a normal-model assumption.
This does not automatically prove that a result is wrong, because real lab data can be skewed, bounded, or affected by method-specific variation.
A high z-score can reflect a real high sample value, a bad reference mean, an underestimated standard deviation, or a unit mismatch.
Rounding matters because a small standard deviation can make tiny input changes produce a large z-score change.
Keep enough decimal places in your mean and standard deviation when you report z-score calculations in lab notes or homework.