Outlier Checker methods for lab replicate values
An outlier checker helps you find values that sit unusually far from the rest of a numerical dataset.
In lab work, a possible outlier may come from a pipetting error, a transcription error, a failed blank correction, a mislabeled tube, or a real but unusual sample response.
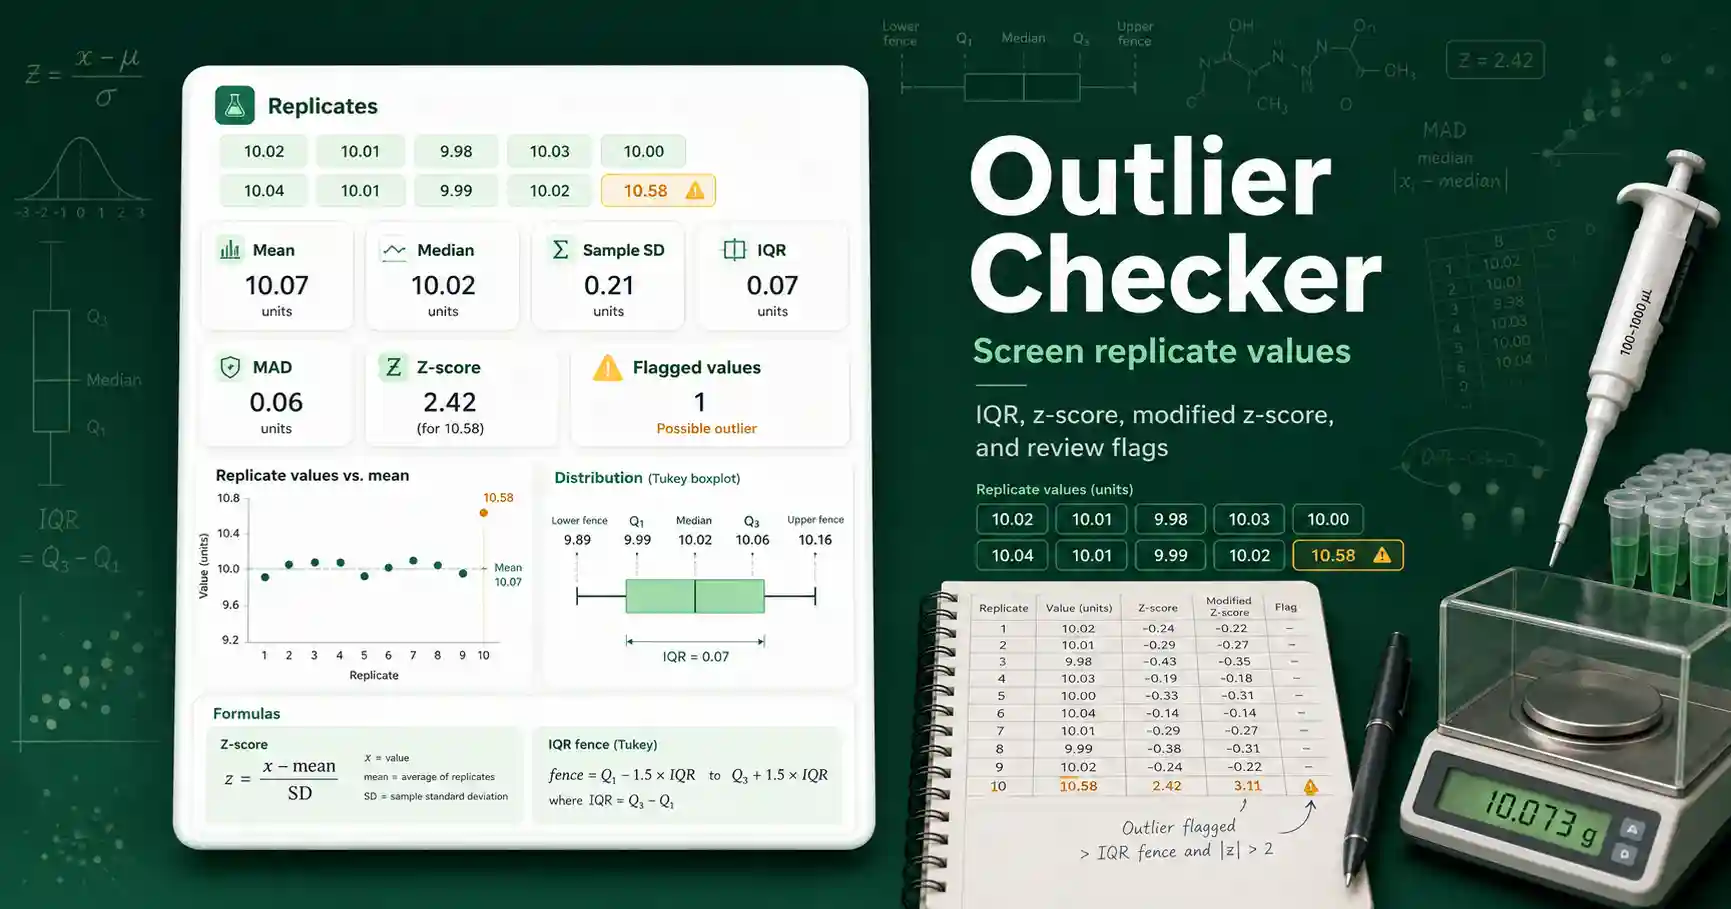
This calculator screens pasted values with three common rules: the IQR fence, the ordinary z-score, and the modified z-score.
The IQR method uses the middle half of the data, so it is less sensitive to one extreme value than the mean-based z-score method.
The lower IQR fence is Q1 − 1.5 × IQR, and the upper IQR fence is Q3 + 1.5 × IQR.
A value below the lower fence or above the upper fence is flagged for review.
The ordinary z-score method calculates how many sample standard deviations a value sits from the sample mean.
The modified z-score method uses the median and median absolute deviation, so it is often more stable when a dataset has one suspicious value.
NIST explains that outliers may indicate bad data, an experimental problem, or a real feature of the dataset, so detection should be followed by context-based review in its Engineering Statistics Handbook discussion of outlier detection.
Outlier Checker inputs and assumptions
The only required input is a set of at least three numeric values.
You can paste values separated by commas, spaces, semicolons, or line breaks.
All values should describe the same measurement type and the same unit.
If one absorbance value is in AU, every other value in the dataset should also be in AU.
If one concentration value is in µM, every other concentration value should also be in µM.
The z-score threshold controls how far a value must sit from the mean before the tool flags it.
A threshold near 2 is more sensitive, while a threshold near 3 is more conservative.
The modified z-score threshold is commonly set around 3.5 for robust screening.
Small datasets need careful interpretation because one extreme value can strongly affect the mean and sample standard deviation.
Use the Sample Mean Calculator when you need a clean summary of mean, median, range, and standard error before writing a report.
Use the Z-Score Calculator when you already know the reference mean and standard deviation and want to standardize one specific value.
Outlier Checker result interpretation
A flagged value is not automatically wrong.
A flagged value means the number deserves review before you average, report, or remove it.
Check whether the sample was diluted differently from the others.
Check whether the raw reading was copied with the correct decimal place.
Check whether a plate well, cuvette, or tube had a visible handling issue.
Check whether the value matches a real sample difference that should remain in the dataset.
If a value is flagged by all three methods, it deserves stronger attention than a value flagged by one method only.
If no value is flagged, the dataset may still contain systematic error, bias, or a wrong unit conversion.
Rounding matters because a small replicate spread can make a small absolute difference look large by z-score.
Keep enough decimal places from the original measurements when you check possible outliers.
Verify critical lab calculations independently before using them in real experiments.