Standard Curve Calculator for qPCR data
A Standard Curve Calculator helps you analyze qPCR standards. You enter a known template quantity and its Ct value for each dilution point. The tool fits a straight line between Ct and log10 quantity. It then reports the slope, intercept, R², amplification efficiency, and unknown sample quantity.
Use this calculator when you prepare absolute quantification standards, check qPCR assay efficiency, validate a primer pair, or estimate copy number from unknown Ct values. Keep the quantity unit consistent. If your standards are copies per reaction, the unknown result is copies per reaction. If your standards are pg, the unknown result is pg.
How the qPCR standard curve equation works
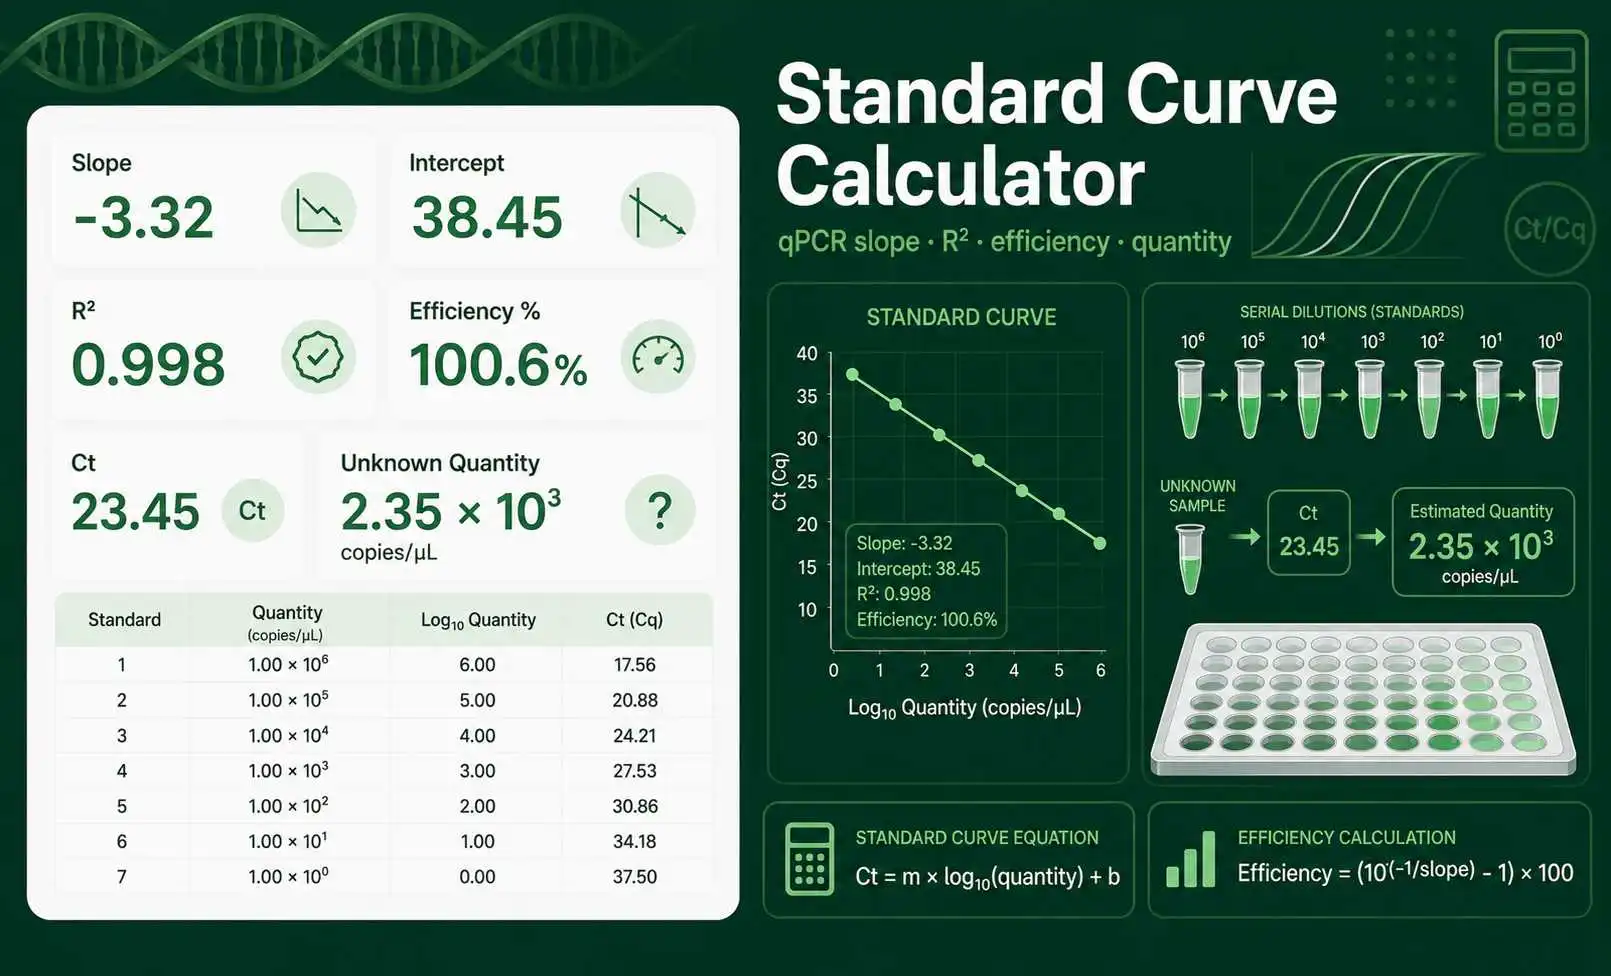
The calculator uses the equation Ct = m × log10(quantity) + b. In this equation, m is the slope and b is the intercept. A good curve has a negative slope because high template quantity gives a lower Ct value, while low template quantity gives a higher Ct value.
PCR efficiency is calculated from the slope: Efficiency % = (10^(-1/slope) − 1) × 100. A slope near −3.32 gives about 100% efficiency. R² describes how closely your standard points follow a straight line. Bio-Rad describes standard curves as a common way to determine qPCR efficiency, linear dynamic range, and reproducibility.Bio-Rad qPCR assay design guidance
Worked example for standard curve efficiency
Suppose your standards are 1,000,000, 100,000, 10,000, 1,000, and 100 copies. Their Ct values are 17.20, 20.52, 23.83, 27.17, and 30.48. The Ct increases by about 3.3 cycles for each 10-fold dilution. That pattern suggests efficient amplification.
If the regression slope is −3.32, the efficiency calculation is (10^(-1 / −3.32) − 1) × 100. The result is close to 100%. If the slope is −3.80, efficiency is lower. If the slope is −3.00, efficiency is unusually high and may suggest pipetting error, inhibitors, primer-dimer signal, or an incorrect standard dilution.
Using a standard curve to estimate unknown samples
After the calculator finds the equation, it can estimate unknown quantity from Ct. It rearranges the equation as log10(quantity) = (Ct − intercept) / slope. Then it converts the log value back to quantity with 10 raised to that value.
For example, if a sample Ct is 24.65 and the curve equation is Ct = −3.32 × log10(copies) + 37.1, the calculator solves for log10(copies). This gives an estimated copy number in the same unit as the standard input. Do not compare unknowns in ng with standards entered as copies unless you intentionally converted the units first.
Two practical use cases for this calculator
Use case one is absolute qPCR quantification. A lab worker prepares a plasmid, gDNA, cDNA, or synthetic DNA standard with known copy number. The standard curve then converts unknown Ct values into copies per reaction or copies per microliter after dilution correction.
Use case two is assay validation. A researcher tests a primer pair across a dilution series and checks whether the slope, R², and efficiency look acceptable. If efficiency is low, they may adjust primer concentration, annealing temperature, template purity, or dilution accuracy. If R² is weak, they should inspect replicate spread and outlier standards.
Common standard curve mistakes to avoid
Do not mix units in the same curve. Do not enter one standard as copies and another as ng. Do not include standards with failed amplification. Do not use a curve if the standards are not serially diluted correctly. Small pipetting errors can shift Ct values and change the slope.
Avoid estimating unknowns far outside the standard range. If an unknown Ct is lower than the highest standard or higher than the lowest standard, the calculator must extrapolate. For important results, dilute or concentrate the sample and repeat the qPCR so the Ct falls within the curve range.
For related qPCR calculations, you can check assay efficiency with the qPCR Efficiency Calculator or average replicate Ct values with the Ct Mean Calculator before building your final curve.
What to verify before reporting qPCR results
Verify the standard stock concentration, dilution factor, pipetting plan, Ct threshold setting, replicate consistency, no-template control, melt curve, and amplification plot. A good numerical standard curve does not prove target specificity by itself. It only describes the behavior of the measured signal across known quantities.
For lab reports, include the standard curve equation, slope, R², efficiency, dilution range, standard unit, and how unknown quantities were corrected for sample dilution. These details help teachers, supervisors, and reviewers understand how the final quantity was calculated.