Km and Vmax Calculator for enzyme assay data
This Km and Vmax Calculator estimates enzyme kinetic constants from substrate concentration and initial reaction rate pairs. It uses transformed linear fits to provide a quick educational estimate of Km, Vmax, half Vmax, R², and rate-scale error. The tool is useful when students need to check enzyme kinetics homework, when teachers need a simple demonstration of Michaelis-Menten parameters, and when lab workers want a fast sanity check before using a more advanced nonlinear fit.
Km is reported in the same concentration unit used for substrate concentration. Vmax is reported in the same rate unit used for initial velocity. If substrate concentration is entered in mM, the estimated Km is in mM. If initial rate is entered in µmol/min, the estimated Vmax is in µmol/min. The calculator does not guess units because mixed units can make a realistic-looking result wrong.
The calculator expects positive initial rates measured before major substrate depletion. It works best when substrate concentrations cover values below Km, near Km, and above Km. A dataset that only contains very low substrate values may estimate Vmax poorly. A dataset that only contains saturated rates may estimate Km poorly. Good kinetic data need enough spread to show the curve rising and flattening.
Km and Vmax Calculator formula and fitting method
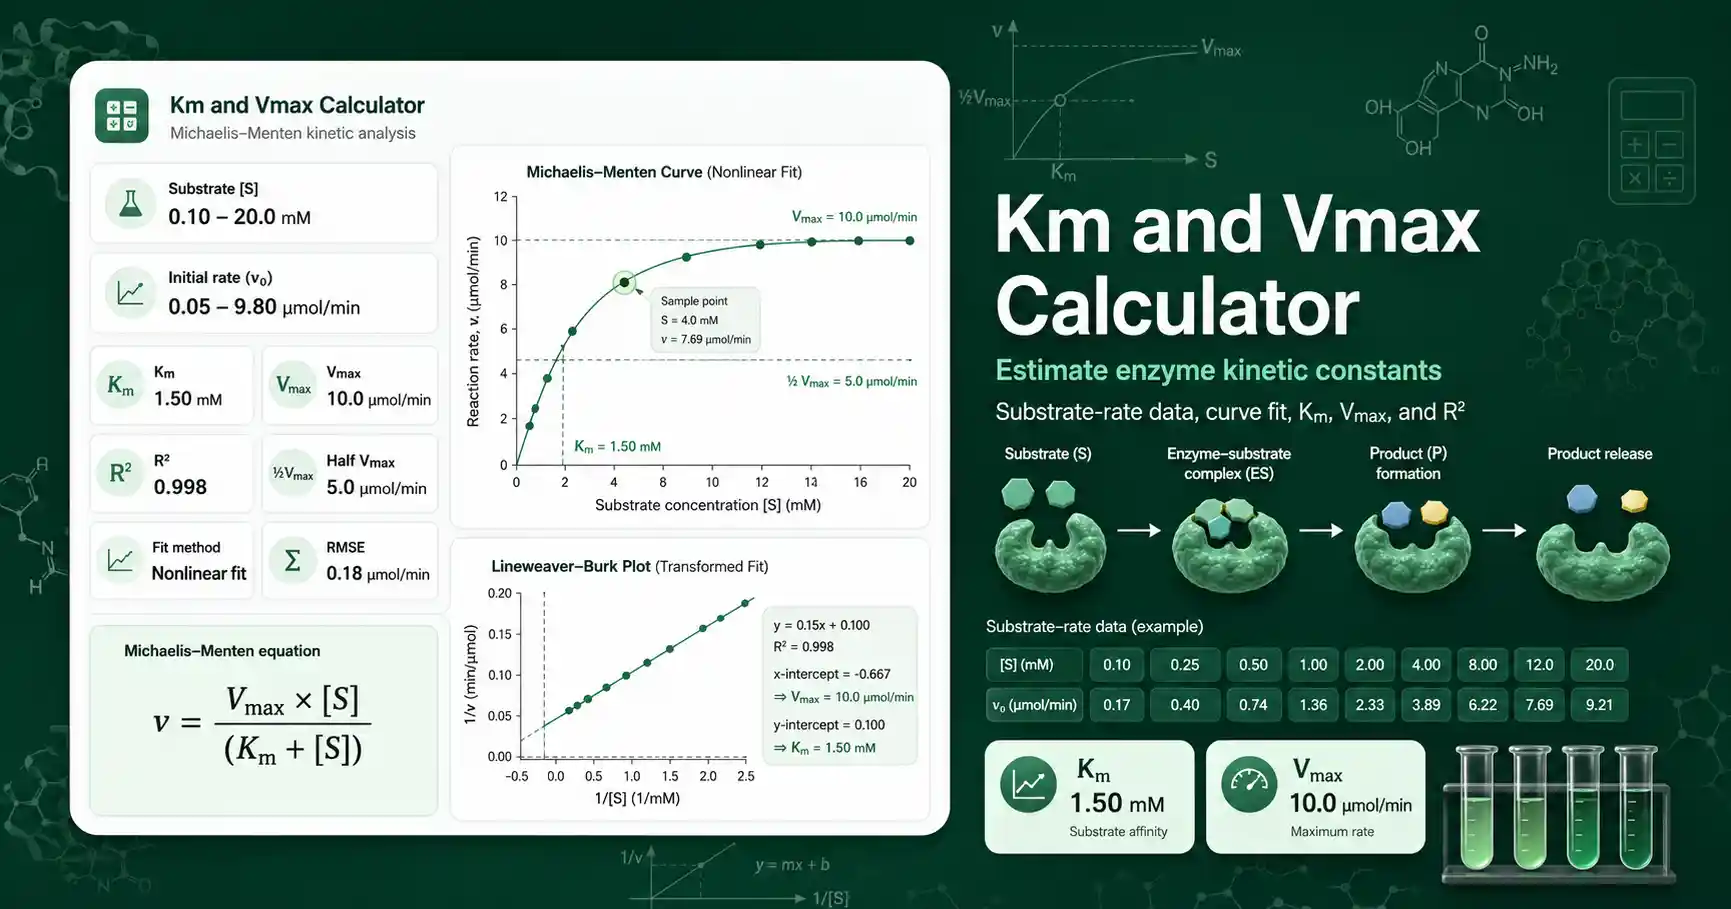
The underlying enzyme model is v = Vmax × [S] / (Km + [S]). The value v is initial rate, [S] is substrate concentration, Km is the Michaelis constant, and Vmax is the fitted maximum rate for the selected enzyme amount and assay conditions. The basic tool uses a Lineweaver-Burk transformation, where 1/v is plotted against 1/[S]. Advanced mode also offers Hanes-Woolf and Eadie-Hofstee transformations for comparison.
The Lineweaver-Burk fit uses 1/v = (Km/Vmax)(1/[S]) + 1/Vmax. The y-intercept gives 1/Vmax, and the slope gives Km/Vmax. The Hanes-Woolf fit uses [S]/v versus [S]. The Eadie-Hofstee fit uses v versus v/[S]. Each transformation can give slightly different estimates because experimental error is redistributed differently across the axes.
Use the Enzyme Kinetics Calculator when Km and Vmax are already known and you want to calculate a single reaction rate. Use the Reaction Rate Calculator when your first step is to calculate velocity from product amount and time. For background on the Michaelis-Menten relationship, Chemistry LibreTexts provides a helpful overview of Michaelis-Menten kinetics.
How to interpret Km and Vmax Calculator results
A fitted Vmax is the model-predicted maximum initial rate under the selected enzyme amount, buffer, temperature, pH, and assay format. It is not a universal property of the enzyme alone. If enzyme concentration doubles, the observed Vmax often changes. If the buffer, temperature, ionic strength, or pH changes, both Km and Vmax may change.
A fitted Km is the substrate concentration where the predicted rate is half of Vmax. A lower Km means the reaction reaches half-maximal rate at a lower substrate concentration under the tested conditions. It does not always equal a direct binding dissociation constant. Mechanism, product release, inhibitor contamination, and assay design can all affect the apparent Km value.
R² describes the fit quality of the transformed plot, not the whole biological truth of the enzyme reaction. A high R² can still hide biased residuals or poor coverage of the saturation region. A low R² can signal noisy measurements, pipetting error, substrate depletion, enzyme instability, allosteric behavior, cooperative kinetics, or an unsuitable transformation. Always inspect the raw substrate-rate pattern before reporting kinetic constants.
Rounding matters for enzyme kinetics. Report Km and Vmax with sensible significant figures. Do not report six decimal places when the underlying rates vary by several percent. Keep raw readings, blank corrections, dilution factors, and time points in the lab notebook. Verify critical lab calculations independently before using them in real experiments.
Km and Vmax Calculator worked example
Given values: substrate concentrations are 0.05, 0.10, 0.25, 0.50, 1.00, and 2.00 mM. Initial rates are 8.7, 16.2, 33.8, 49.5, 66.4, and 80.6 µmol/min. Formula: Lineweaver-Burk uses 1/v = (Km/Vmax)(1/[S]) + 1/Vmax. Substitution: each substrate value is converted to 1/[S], and each rate is converted to 1/v before fitting a straight line. Result: the example data estimate Km close to 0.5 mM and Vmax close to 100 µmol/min. Interpretation: the enzyme reaches about half of its maximum rate near 0.5 mM substrate, and the predicted maximum rate is near 100 µmol/min under the chosen assay conditions.
This example also shows why substrate coverage matters. The dataset includes points below 0.5 mM, near 0.5 mM, and above 0.5 mM. That spread gives the fit information about both the rising part and the flattening part of the Michaelis-Menten curve. A narrow dataset may still produce numbers, but the numbers may not be reliable.