IC50 Calculator for dose-response data
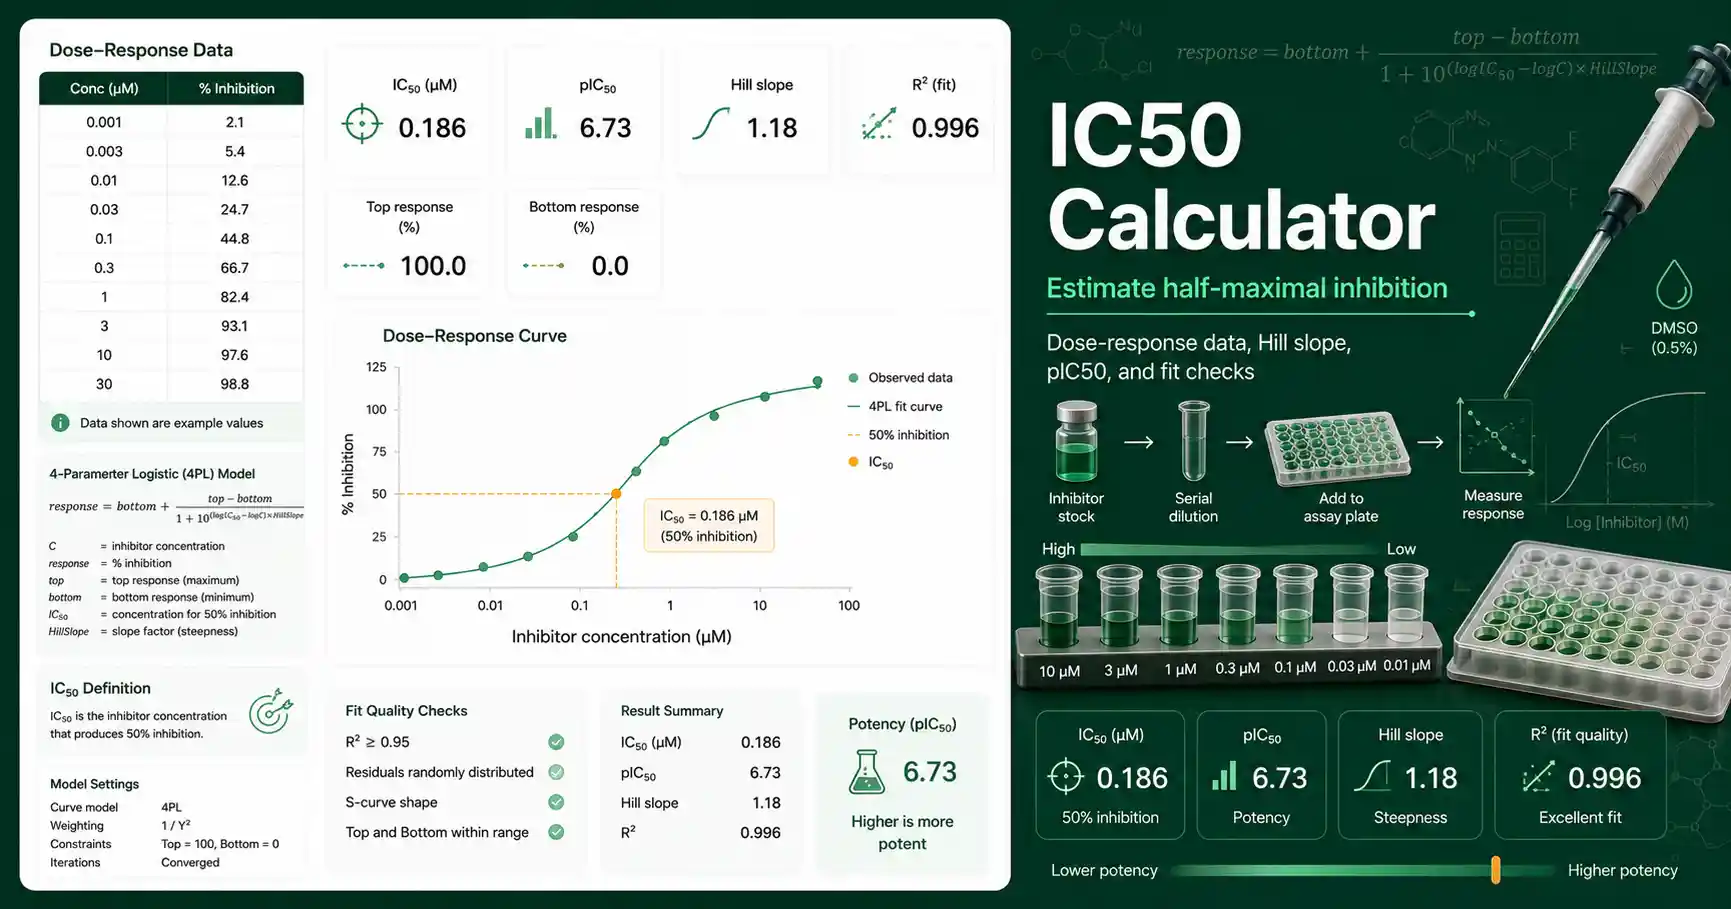
This IC50 Calculator estimates the inhibitor concentration that produces half-maximal inhibition in a dose-response experiment. It accepts concentration-response pairs and fits the middle of the curve on a log concentration scale. It also reports pIC50, which is the negative base-10 logarithm of IC50 in molar units. A smaller IC50 usually means stronger apparent potency under the selected assay conditions. A larger pIC50 also usually means stronger apparent potency because it represents the same concentration on a logarithmic scale.
Students can use the calculator to understand how concentration, response, Hill slope, and curve midpoint connect. Teachers can use it to demonstrate why dose spacing matters near the steep region of an inhibition curve. Lab workers can use it for quick screening summaries before moving results into full statistical software. Researchers can use it as a fast educational check for assay tables, pilot curves, and report drafts. Verify critical lab calculations independently before using them in real experiments.
IC50 Calculator formula and assumptions
The calculator uses a logistic dose-response idea where response changes between a lower plateau and an upper plateau. For percent inhibition data, the lower plateau is estimated from the lowest observed inhibition and the upper plateau is estimated from the highest observed inhibition. The midpoint between those plateaus is the half-maximal response used for the IC50 estimate. The tool estimates Hill slope from the transformed middle points when enough suitable data exist. If a stable transformed fit is not possible, it uses log-dose interpolation across the half-maximal response.
The calculation assumes the concentration column contains positive values. It assumes the selected concentration unit applies to every row. It assumes percent inhibition increases as inhibitor concentration increases. It assumes your data include concentrations below and above the half-maximal response region. It does not replace full nonlinear regression with replicate weighting, confidence intervals, and model comparison. For more background on dose-response interpretation, the NCBI Assay Guidance Manual explains that IC50 is commonly used as a summary measure for competitive binding and functional antagonist assays. Read the NCBI Assay Guidance Manual section on assay operations.
How to calculate IC50 from percent inhibition
Enter one concentration and one percent inhibition value per line. A row such as 0.1 52 means 0.1 µM gives 52 percent inhibition when the selected unit is µM. Include low concentrations that show little inhibition. Include high concentrations that approach maximum inhibition. Place several points around the transition region because those points strongly control the IC50 estimate. If your assay result is still a raw signal, use raw response mode instead of manually guessing percent inhibition.
Raw response mode converts signal into percent inhibition using the high response control and low response control. For many inhibition assays, the high response control is the no-inhibitor signal. The low response control is the full-inhibition or background signal. The formula is percent inhibition equals high control minus sample response divided by high control minus low control, multiplied by 100. That normalization lets absorbance, fluorescence, luminescence, and viability-like readouts become comparable inhibition values.
IC50 result interpretation
The IC50 result is shown in the concentration unit you select. The molar IC50 helps you compare values across studies that use different units. The pIC50 result is useful when values span many orders of magnitude. An IC50 of 0.1 µM equals 1 × 10^-7 M and gives pIC50 7.0. The Hill slope describes how sharply the response changes around the midpoint. A Hill slope near 1 is common in simple educational examples, but real assay data can differ. A high R squared can support a clean curve, but it does not prove that the biology follows a perfect model.
Check the review notes if the curve does not approach both plateaus. An IC50 outside the tested concentration range is an extrapolated estimate. A narrow response range can make the midpoint unstable. Replicate variability can shift the curve and should be considered before making conclusions. Solvent concentration, incubation time, substrate concentration, enzyme amount, and detection chemistry can all affect the apparent IC50. For inhibitor setup before running the assay, use the Inhibitor Dilution Calculator to plan working solutions and solvent percent. For enzyme assays, the Enzyme Kinetics Calculator can help connect substrate concentration, Km, Vmax, and rate.