Biochemistry calculator
EC50 Calculator
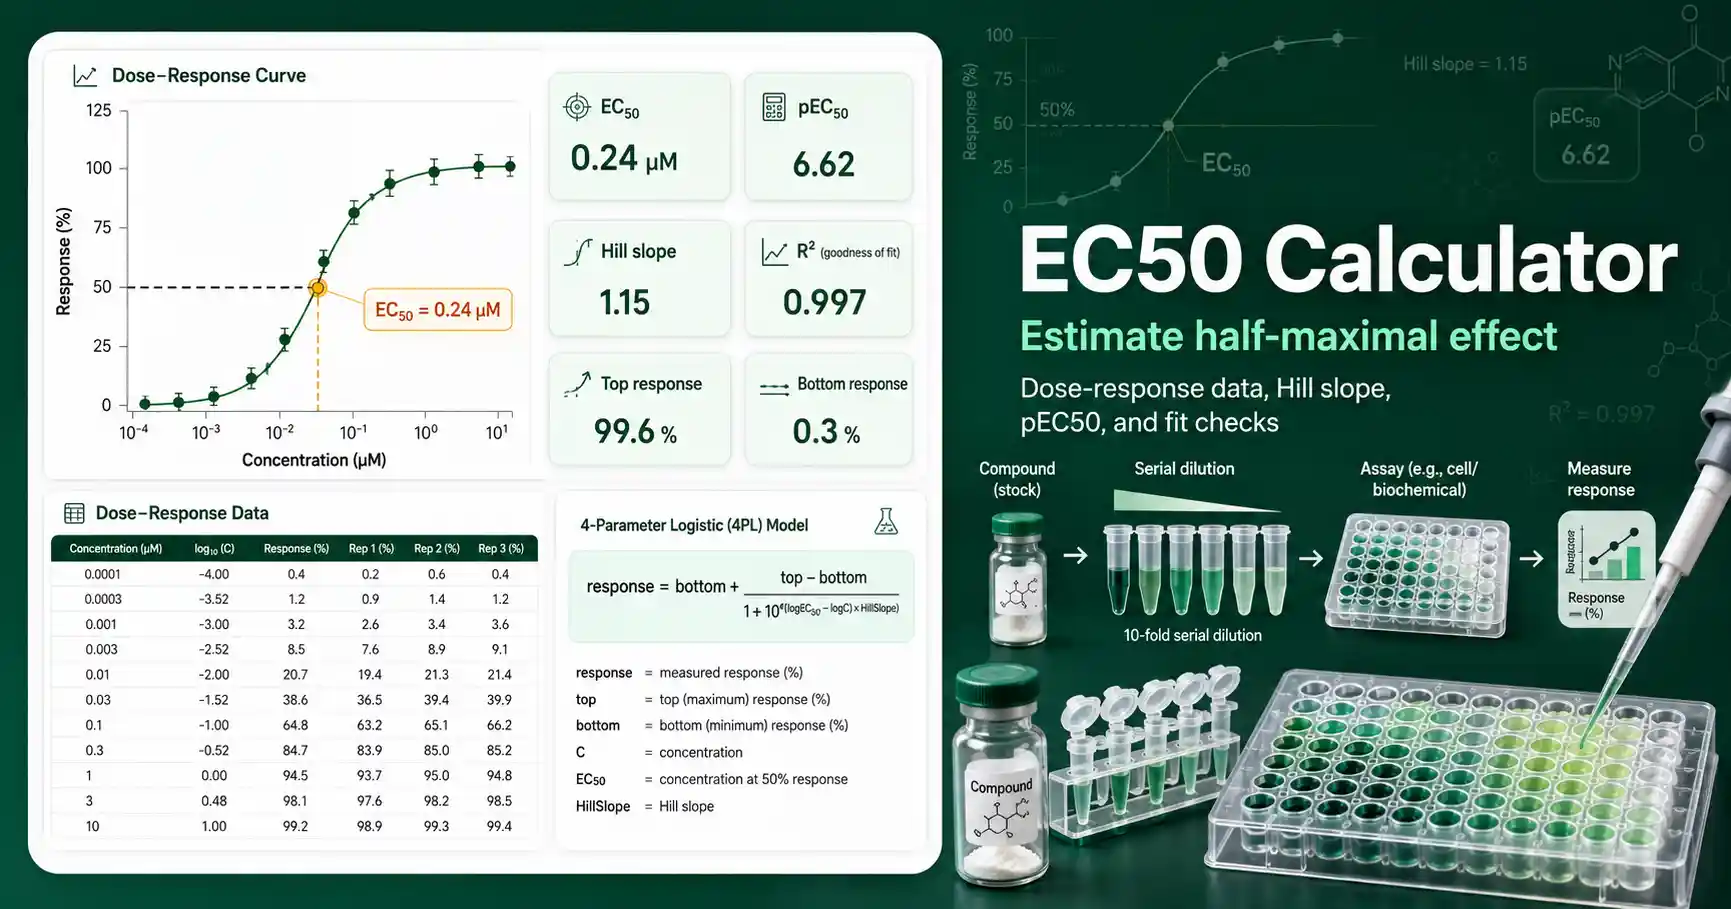
Estimate EC50 from concentration-response data and review pEC50, Hill slope, top response, bottom response, and fit quality in one browser-based calculator.
Dose-response calculator
Estimate EC50 from response data
Paste concentration and response pairs. The calculator normalizes the response range, estimates the midpoint, and reports EC50, pEC50, Hill slope, and fit checks.
Input data
Use one pair per line: concentration, response.
Responses can be percent effect, normalized signal, viability, or activity. Choose the curve direction below.
EC50 result
Half-maximal effective concentration estimate.
The EC50 falls inside the measured range, so the estimate is anchored by the tested data.
Tested range
0.001 to 3 µM
EC50 Calculator for dose-response assay data
The EC50 Calculator estimates the effective concentration that produces half of the maximal response in a concentration-response experiment.
EC50 is widely used when a signal increases with concentration, such as receptor activation, enzyme activation, fluorescence response, binding response, or cell-response assays.
You can paste concentration and response pairs into the calculator, and it will estimate the midpoint of the curve.
The calculator also reports pEC50, which is the negative base-10 logarithm of EC50 when EC50 is expressed in molar concentration.
A higher pEC50 usually means a lower EC50 and stronger apparent potency, but only when the same assay format and concentration unit are used.
Students can use this tool to understand how the half-maximal point relates to a sigmoidal dose-response curve.
Teachers can use it to demonstrate why midpoint coverage is more important than having many points only at the baseline or plateau.
Lab workers can use it to check whether their dilution series captures the response transition zone.
Researchers can use it for quick educational review before moving data into a full statistics or graphing package.
For inhibition curves where the response decreases, use the direction control or use the related IC50 Calculator when the endpoint is half-maximal inhibition.
EC50 Calculator formula and assumptions
A common dose-response model describes response as bottom plus the response range divided by a logistic term.
The midpoint is the concentration where the fitted response is halfway between the bottom and top plateaus.
This page uses a browser-side approximation that normalizes the response range and estimates a Hill-style slope from transformed points.
It is intended for clear educational dose-response datasets rather than regulatory analysis or final publication statistics.
A good dataset should include several concentrations below EC50, several above EC50, and at least a few points close to the half-maximal response.
The concentration values must be positive because the fit uses logarithmic concentration.
The response values should use a consistent scale, such as percent activation, percent viability, normalized signal, or percent effect.
The calculator assumes a monotonic curve, so it works best when the response mostly rises or mostly falls across the dose range.
Very noisy data, biphasic responses, hook effects, poor baseline subtraction, or incomplete plateaus can make the EC50 unstable.
The NCBI Assay Guidance Manual discusses concentration-response curves and curve-fit interpretation in assay development contexts: NCBI Assay Guidance Manual.
EC50 Calculator result interpretation
The EC50 result has the same concentration unit as the input concentrations.
If you enter concentrations in µM, the reported EC50 is in µM.
If you enter concentrations in nM, the reported EC50 is in nM.
Unit consistency matters because pEC50 only has the usual pharmacology meaning when the concentration is converted to molar units before taking the negative log.
The top response is the upper plateau estimated from the highest response region.
The bottom response is the lower plateau estimated from the lowest response region.
The Hill slope describes how sharply the response changes near the midpoint.
A steep Hill slope can suggest cooperative behavior, assay compression, or a narrow transition region.
A shallow Hill slope can reflect weak responsiveness, mixed populations, low signal range, or noisy data.
The fit R² is a quick quality indicator, but it does not prove that the biological model is correct.
Always inspect the raw dose-response pattern and confirm that the response direction matches the option selected in the calculator.
If you need to convert stock and working concentrations before building the curve, an inhibitor dilution calculation may help prepare the concentration series.
EC50 Calculator worked example
Given values: a response assay gives 2.5%, 5.8%, 12.7%, 28.4%, 51.6%, 74.2%, 89.5%, and 96.1% response at 0.001, 0.003, 0.01, 0.03, 0.1, 0.3, 1, and 3 µM.
Formula: response = bottom + (top − bottom) / (1 + 10^((logEC50 − logC) × HillSlope)).
Substitution: the half-maximal response is near the midpoint between the low plateau near 2.5% and the high plateau near 96.1%.
Result: the curve midpoint occurs close to 0.1 µM in this dataset.
Interpretation: the sample reaches half-maximal effect at roughly 0.1 µM under this assay format and response scale.
A result near 0.1 µM is reasonable because the measured response at 0.1 µM is already close to the halfway response.
If all values below 0.1 µM were missing, the calculator would rely more heavily on extrapolation and the EC50 would be less reliable.
Verify critical lab calculations independently before using them in real experiments.
Student Questions About EC50 Calculator
What does the EC50 Calculator estimate?
The EC50 Calculator estimates the concentration that gives half of the maximal effective response in a dose-response assay.
Can I use percent viability data in the EC50 Calculator?
Yes. Use decreasing response mode when viability, activity, or signal decreases as concentration increases.
Why should EC50 fall inside the tested concentration range?
An EC50 inside the tested range is supported by measured points near the curve midpoint. An EC50 outside the range is extrapolated and less reliable.
Is EC50 the same as IC50?
EC50 describes half-maximal effective response, while IC50 describes half-maximal inhibition. The curve direction and biological endpoint decide which term fits the assay.