Base Composition Calculator for DNA and RNA
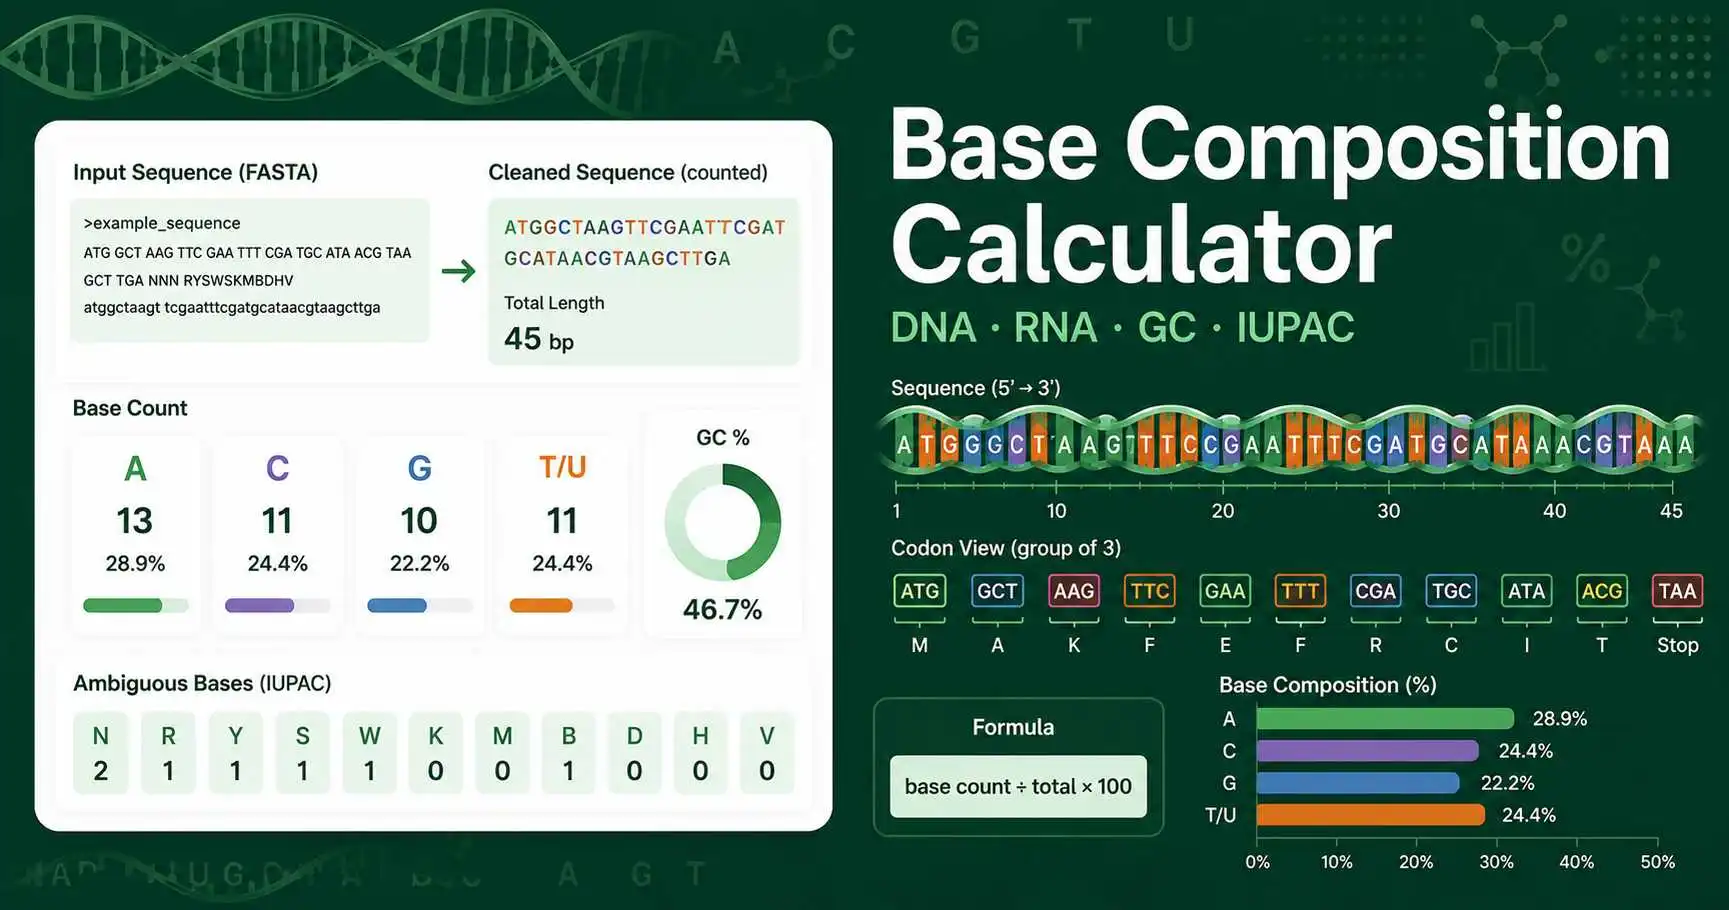
A Base Composition Calculator tells you how many times each nucleotide appears in a DNA or RNA sequence. It reports A, C, G, T, or U counts and converts those counts into percentages. It also separates exact nucleotide bases from IUPAC ambiguity symbols such as N, R, Y, S, W, K, M, B, D, H, and V.
Use this tool when you need a quick sequence composition report for a primer, gene fragment, PCR product, RNA transcript, cloning insert, sequencing read, or homework sequence. The result helps you understand whether a sequence is GC-rich, AT-rich, AU-rich, ambiguous, or ready for a more specific analysis.
How to calculate base composition from a sequence
Paste your sequence into the input box. The calculator removes FASTA headers, spaces, line breaks, and numbers. It then counts each valid symbol and divides each count by the total sequence length to calculate base percentage.
Choose auto detection for normal sequences. Choose DNA mode if your sequence uses thymine T. Choose RNA mode if your sequence uses uracil U. Do not mix T and U unless you are checking an error in copied sequence data.
Base composition results explained
The length value shows the total number of accepted symbols after cleaning. Exact bases are A, C, G, and T for DNA, or A, C, G, and U for RNA. Ambiguous bases are IUPAC symbols that represent more than one possible nucleotide.
GC content uses the count of guanine plus cytosine. This value matters because GC base pairs have stronger bonding than AT or AU-rich regions. A high GC percentage can increase melting temperature, while a low GC percentage can reduce duplex stability. For a direct percentage-only workflow, compare this page with the GC Content Calculator.
Codon grouping is included for students and gene-sequence checks. It shows how many complete triplets fit into the cleaned sequence and whether one or two bases remain. A sequence length divisible by 3 is often important when reading a coding sequence in frame.
Formula used by the Base Composition Calculator
The formula is simple: base percentage equals base count divided by total accepted sequence length, multiplied by 100. GC content equals G plus C divided by total exact bases, multiplied by 100. The tool also shows GC percentage against the full sequence when ambiguous bases are present.
This method makes the assumptions clear. Ambiguous bases are counted as their own symbols. They are not automatically split across possible bases, because N, R, Y, and similar codes can represent multiple biological possibilities.
When students and lab workers use base composition
Students use base composition to understand nucleotide sequence structure, Chargaff-style base patterns, GC content, codon grouping, and FASTA cleanup. Teachers can use the output in worksheets, lab reports, and sequence-analysis demonstrations.
Lab workers use base composition before primer checks, PCR planning, sequencing review, cloning insert inspection, and synthetic DNA ordering. It gives a quick first look before using more specialized tools such as a Sequence Length Calculator, ORF finder, or primer design workflow.
Common mistakes in base composition analysis
The most common mistake is pasting a sequence with extra symbols from a document, spreadsheet, or primer order form. Another mistake is mixing DNA and RNA notation. T belongs to DNA. U belongs to RNA. The tool warns you when those symbols appear together in auto mode.
Another issue is treating ambiguous bases as exact bases. An N does not mean A, C, G, and T all appear once. It means the base is unknown or variable. Keep that distinction clear when writing homework answers, lab notes, or sequence reports.
For background on nucleotide symbols and sequence records, the NCBI guide to sequence formats and records is a useful scientific reference.NCBI Bookshelf sequence records
What to verify before real lab use
Verify the source sequence, strand direction, organism, gene name, transcript version, primer orientation, and any ambiguity symbols before you use results in real lab work. If you plan PCR, cloning, sequencing, or qPCR, also check target specificity, melting temperature, primer dimers, and expected product length.
This calculator gives a fast educational composition summary. It does not replace validated sequence analysis software, supplier tools, or your lab protocol for critical experimental decisions.