Analytical chemistry calculator
Absorbance to Concentration Calculator
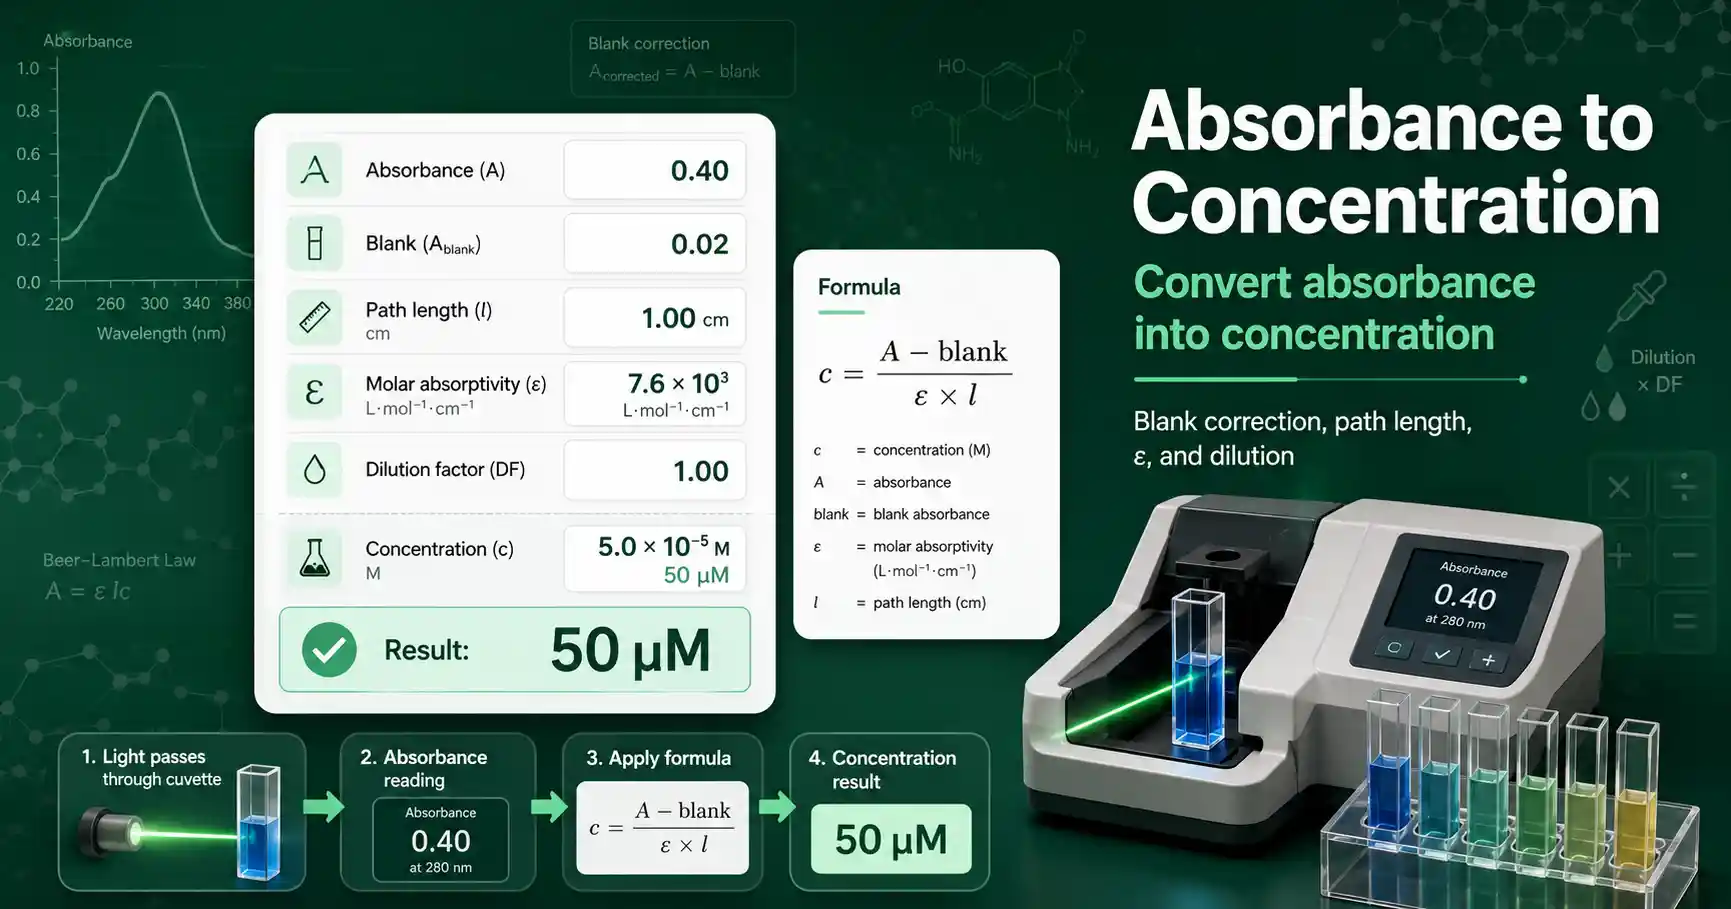
Calculate concentration from absorbance with blank correction, path length, molar absorptivity, and dilution factor. The calculator uses the Beer-Lambert relationship for clear spectrophotometry results.
Spectrophotometry calculator
Convert absorbance to concentration
Enter absorbance, blank, path length, and molar absorptivity to estimate sample concentration with the Beer-Lambert relationship.
Calculated concentration
Absorbance is in a commonly useful range for many spectrophotometer measurements.
Absorbance to Concentration Calculator formula
This calculator converts a spectrophotometer absorbance reading into concentration. It is useful when the analyte has a known molar absorptivity at the measured wavelength. The calculation starts with the measured sample absorbance. It subtracts the blank absorbance when a blank value is entered. It then divides the corrected absorbance by the product of molar absorptivity and optical path length.
The core equation is c = A / (ε × l). In this equation, c is concentration in mol/L, A is corrected absorbance, ε is molar absorptivity in L mol⁻¹ cm⁻¹, and l is path length in centimeters. The advanced mode also applies a dilution factor. A 1:10 dilution uses a dilution factor of 10 because the original sample is ten times more concentrated than the measured tube.
This page is closely related to the Beer-Lambert Law Calculator, but it is focused on the common lab task of converting absorbance directly into concentration. Use the Calibration Curve Calculator when your method depends on standards instead of a published or known extinction coefficient.
How this calculator handles absorbance readings
Absorbance has no unit, but the concentration result depends strongly on the units used for ε and path length. If ε is entered in L mol⁻¹ cm⁻¹ and path length is entered in cm, the calculated concentration is in mol/L. The calculator can display that same molar concentration as M, mM, µM, or nM. It can also estimate mg/mL when molecular weight is supplied.
A blank reading corrects background absorbance from the cuvette, solvent, buffer, or reagent mixture. The corrected absorbance must be greater than zero. A negative or zero corrected value usually means the blank is too high, the sample signal is below background, or the wrong wavelength was used. The calculator blocks these invalid states so it never reports impossible values.
Path length matters because a longer light path produces more absorbance for the same concentration. A standard square cuvette commonly uses a 1 cm path length. Microplate readers often use a shorter effective path length unless path-length correction is enabled. Always match the path length value to the instrument setup.
Molar absorptivity is wavelength-specific. A compound can have a strong signal at one wavelength and a weak signal at another. Use the ε value that matches the analyte, wavelength, solvent condition, and chemical form. Chemistry LibreTexts gives a useful educational overview of the Beer-Lambert law and how absorbance relates to concentration.
Absorbance result interpretation for lab work
Many spectrophotometer methods work best when absorbance is comfortably within the linear range of the instrument and assay. A value near 0.1 to 1.0 is often easier to trust than a very high value. Very low absorbance can be dominated by blank noise or baseline drift. Very high absorbance can suffer from stray light, detector limits, and non-linear response.
The calculator gives an interpretation note based on corrected absorbance. This note does not replace method validation. It helps students and lab workers decide whether dilution, re-reading, or a new standard range may be needed. A high corrected absorbance usually suggests that the sample should be diluted and measured again.
Dilution factor is applied after the measured concentration is calculated. If the diluted tube reads 20 µM and the dilution factor is 5, the original sample is estimated as 100 µM. This assumes the dilution was mixed well and the absorbance response remains linear. Rounding is kept sensible so the result is readable without implying more accuracy than the measurement supports.
Students can use this tool to check homework problems involving absorbance, concentration, path length, and extinction coefficient. Teachers can use it to show how changing ε or path length changes the result. Lab workers can use it for quick educational checks before writing calculations into a notebook. Researchers can use it as a transparent companion calculation, but critical lab calculations should still be verified independently before real experiments.
Absorbance to Concentration Calculator worked example
Given values: Absorbance = 0.600, blank = 0.000, path length = 1 cm, molar absorptivity = 12,000 L mol⁻¹ cm⁻¹, and dilution factor = 1.
Formula: c = (A − blank) / (ε × l).
Substitution: c = (0.600 − 0.000) / (12,000 × 1).
Result: c = 0.00005 mol/L, which equals 50 µM.
Interpretation: The measured sample concentration is 50 µM under a 1 cm path length and an extinction coefficient of 12,000 L mol⁻¹ cm⁻¹.
Common mistakes when converting absorbance to concentration
Do not use percent transmittance directly as absorbance. Convert transmittance to absorbance first if your instrument reports transmittance. Do not mix millimeters and centimeters for path length. Do not use an extinction coefficient from a different wavelength unless the method allows it. Do not ignore dilution factor when the sample was diluted before measurement.
Do not assume every assay follows Beer-Lambert behavior across all concentrations. Colored reagents, turbidity, fluorescence interference, precipitates, and matrix effects can break the linear relationship. When standards are available, a calibration curve is often more appropriate than a single ε value. Always record the wavelength, blank, path length, dilution factor, and calculation method in a lab report.
You Might Ask About Absorbance Concentration
How do I calculate concentration from absorbance?
Subtract the blank absorbance, then divide the net absorbance by molar absorptivity and path length. Multiply by the dilution factor if the measured sample was diluted before reading.
What unit should molar absorptivity use?
Use L mol^-1 cm^-1 when path length is in centimeters. This unit combination gives concentration in mol/L.
When should I use a calibration curve instead?
Use a calibration curve when molar absorptivity is unknown, when the assay matrix changes the signal, or when standards are required for the method.
Can this calculator be used for proteins?
Yes, it can be used for proteins when you know the correct extinction coefficient and the absorbance reading is within the method range. For dye-binding assays such as Bradford or BCA, a standard curve is usually the better calculation.